Reports module Overview
Reports provide information on the current state of your firm; allowing you, among other things, to know the matters that have been delayed or how the flow of funds is working. In this guide, you will understand how the Reports module works, what elements it contains, and what information is displayed.
Table of contents
- Accessing Reports module
- General elements in reports
- Billing reports
- Payments reports
- Activities reports
- Matters reports
Accessing Reports module
The Reports module contains a set of reports to observe and analyze the performance of your firm and its financial status, with the aim of being able to help you in making decisions without the need to feel overwhelmed; since the data is displayed in an organized way to facilitate the reading and understanding of the information.
To access the Reports module, simply click the Reports (![]() ) link on the left side panel. To access a specific report, hover over the Reports (
) link on the left side panel. To access a specific report, hover over the Reports (![]() ) link and the appropriate report category in the displayed submenu.
) link and the appropriate report category in the displayed submenu.

From the Reports window you will see on the left the tabs with the different categories of reports that Maatdesk offers and on the right the set of reports associated with the category; each of them will offer you relevant information that will help you understand the firm behavior. To view a report, click the View Report button on the right side of the item you want to observe and analyze.
Maatdesk offers seven (7) types of reports grouped into three (3) categories.
General elements in reports
All reports have common options or features that facilitate both interaction with them and their understanding. Below is a description of each of them:
Export to PDF option
All reports can be exported as PDF by clicking the Export to PDF (![]() ) button , located first on the right side of the report window. With this option, you can save the current report on your device or open it directly and once opened, you can click the Print button of your PDF reader or browser plugin and print the generated document.
) button , located first on the right side of the report window. With this option, you can save the current report on your device or open it directly and once opened, you can click the Print button of your PDF reader or browser plugin and print the generated document.
To be able to download PDF files, your browser must allow pop-ups, read these external guides for the most popular browsers:
Filter panel option
Most reports have a filter panel (in some cases with filters already pre-activated when accessing the report) to reduce the information based on a search criteria defined by the user, showing only the relevant information among the possible amount of data existing.
Only a small number of reports do not have this option due to their nature or the number of columns they must display.
Read the Filtering in Maatdesk guide to learn more about these types of filters.
Charts option
Some reports allow to display the most relevant information in the form of charts, summarizing it for easy reading, understanding and analysis. While charts show synthesized information, tables, on the other hand, can often be extensive due to the large number of elements and information they can contain.
The charts will be displayed if the switch (![]() /
/![]() ) located in the upper left corner of the report window is activated.
) located in the upper left corner of the report window is activated.
Payments reports
Payment reports allow to know the funds flow within the firm in order to improve its management and take alternatives to approach clients to avoid delays in payments.
This category includes the following types of reports:
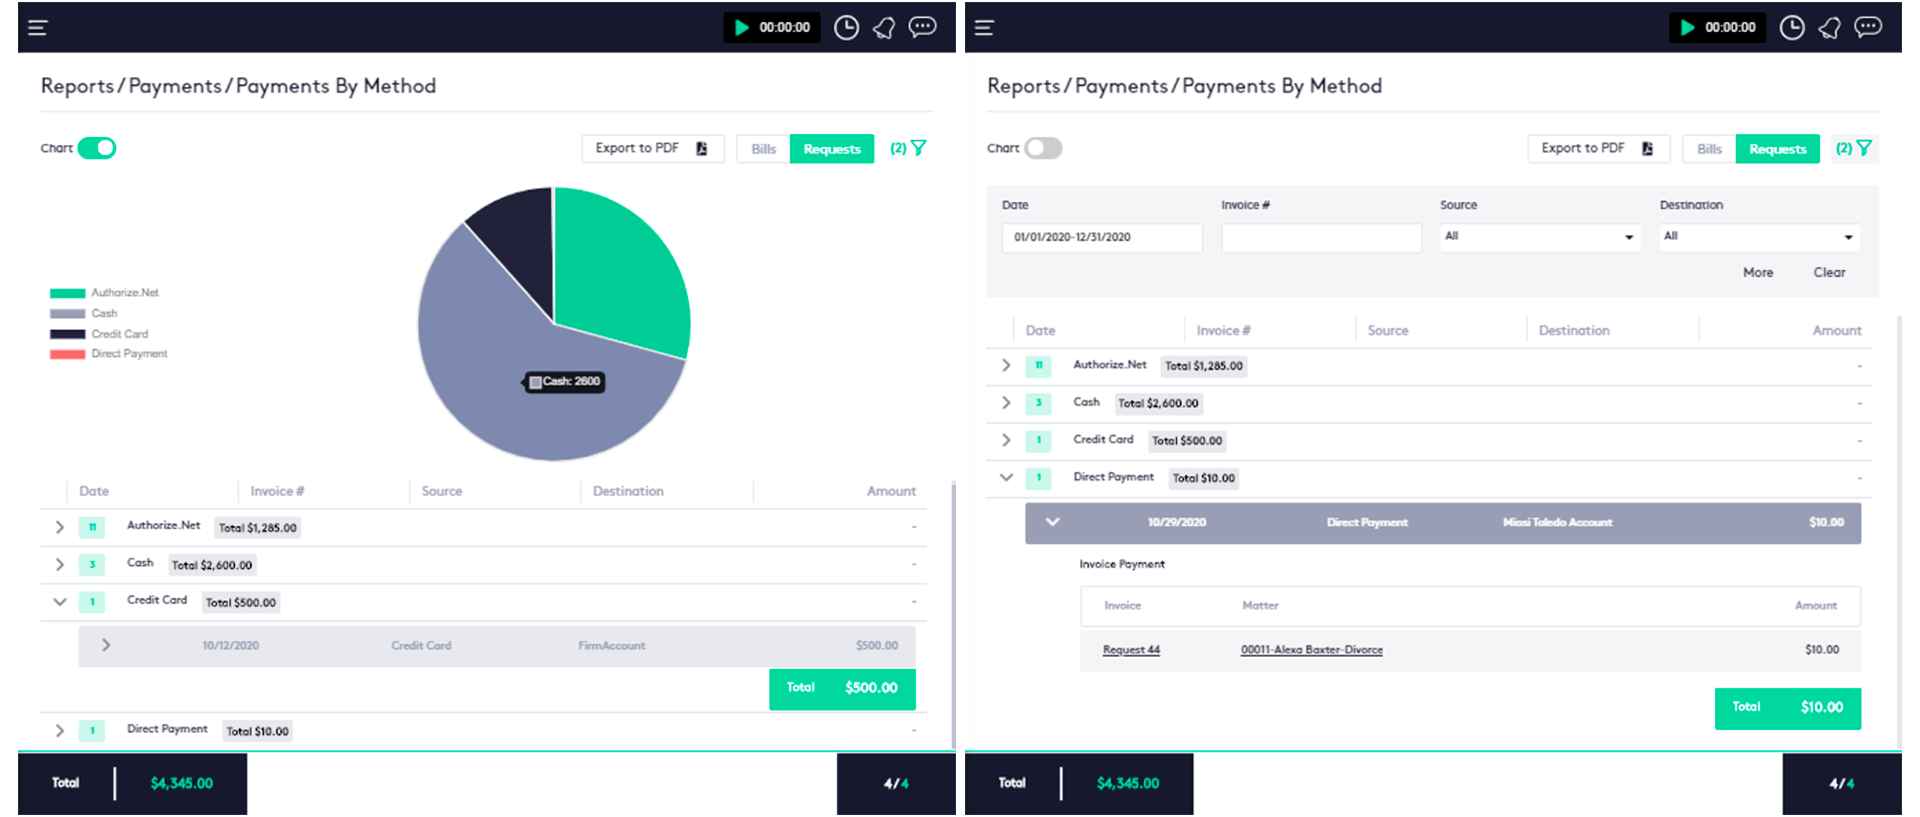
Payments by method
This type of report shows information of all payments organized by the method used by the client when making it. They aim to know the most used payment methods and the funds obtained by each one of them, by showing you the flow of payments mainly by source and destination and all the variables related to payments, amount, matters and others.
This report window will show:
- A Chart option that will show the total amount for each of the payment methods in a pie chart.
- Export to PDF button.
- Status filter: Shows only the payments created through one of the two available ways (Bills or Requests).
- Filter panel: Allows to narrow the search to show only the information of interest to the user.
- Table with payment methods: Shows the detailed information of each of the methods used to make a payment. Each payment method will contain internally the information of the payments made, such as the date, for which bill or request it was made and to what matter it corresponds, deposits and their information if they exist and amount paid.
- Payment methods are sorted in ascending alphabetical order.
- Payment information is sorted in ascending order by date.
- Bill and matter names are links that will redirect to the corresponding Invoice Details window or Matter dashboard.
- Summary: Shows the total amount of funds raised.
Read the following guides or tutorials for more information about payments:
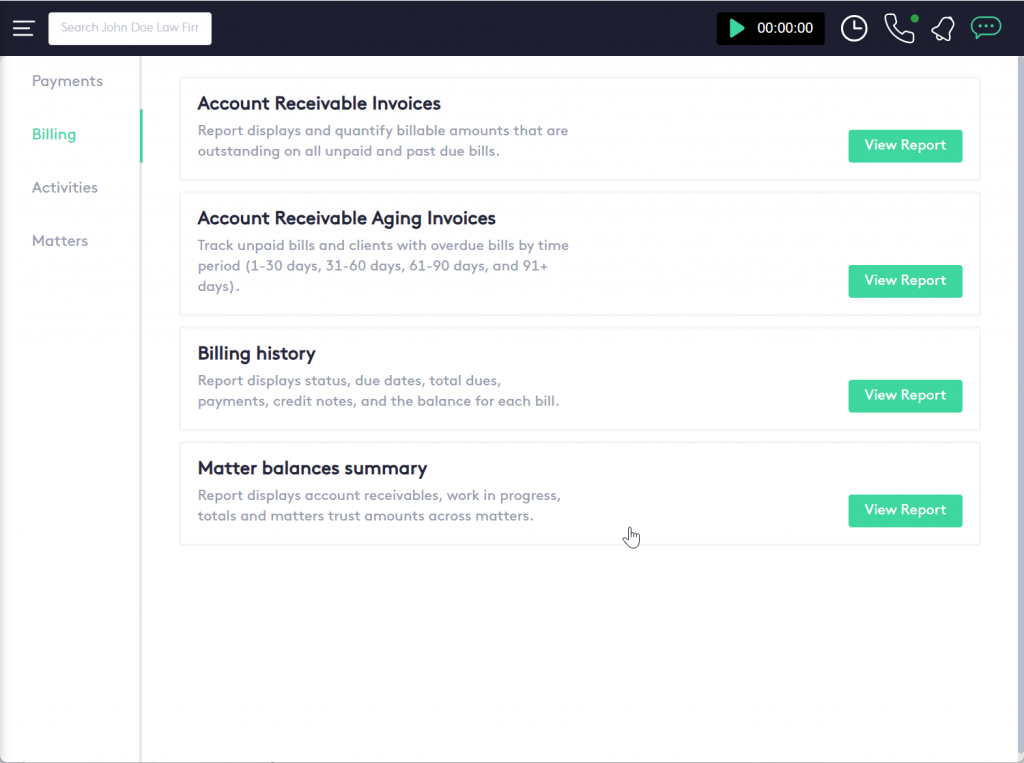
Billing reports
Billing reports allow firms to review, analyze, and manage all bill-related information in order to strengthen financial oversight, identify outstanding amounts, and ensure timely follow-up with clients. These reports provide clear visibility into billed work, overdue invoices, payment progress, and matter-level balances.
This category includes the following four report types:
1. Account Receivable Invoices
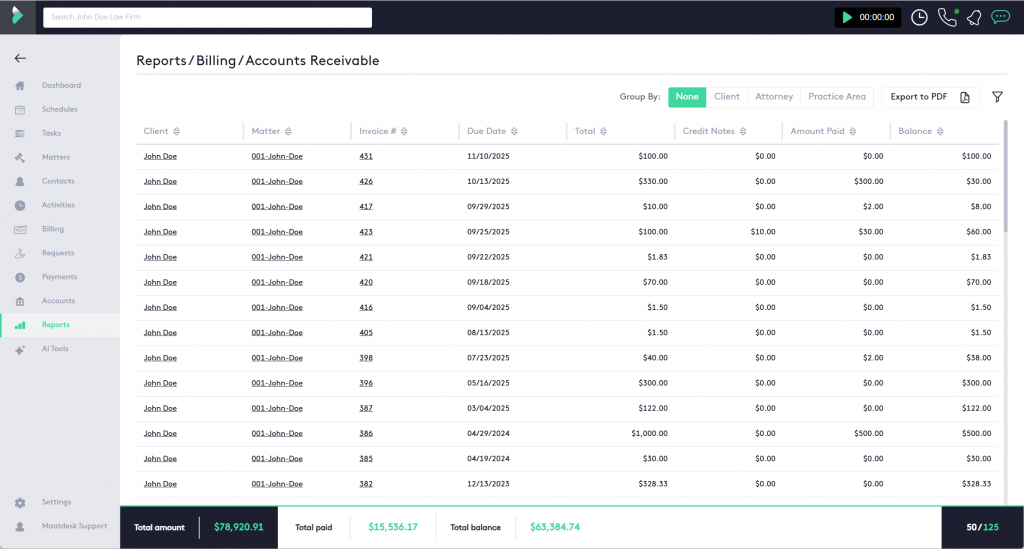
Shows all invoices that are currently unpaid or partially paid, allowing the firm to track outstanding balances, follow up with clients, and maintain full visibility of receivables. This report helps identify overdue bills, monitor collection efforts, and understand the firm’s overall expected income from pending invoices.
This report window will show:
Filter panel: Allows narrowing the search to show only the information of interest to the user.
Group By options:
Allows grouping the report by Client, Attorney, or Practice Area, or viewing all invoices without grouping.
Table with invoices:
Shows a detailed list of all outstanding and partially paid invoices. Each invoice row contains:
- Client name
- Matter name
- Invoice number
- Due date
- Total amount of the invoice
- Credit notes applied (if any)
- Amount paid
- Balance still owed
- Client and matter names are links that redirect to the respective Matter and Contact dashboards for quick review.
- Columns can be sorted in ascending or descending order.
Summary:
Shows the overall totals for:
- Total amount invoiced
- Total paid
- Total balance still pending
2. Account Receivable Aging Invoices
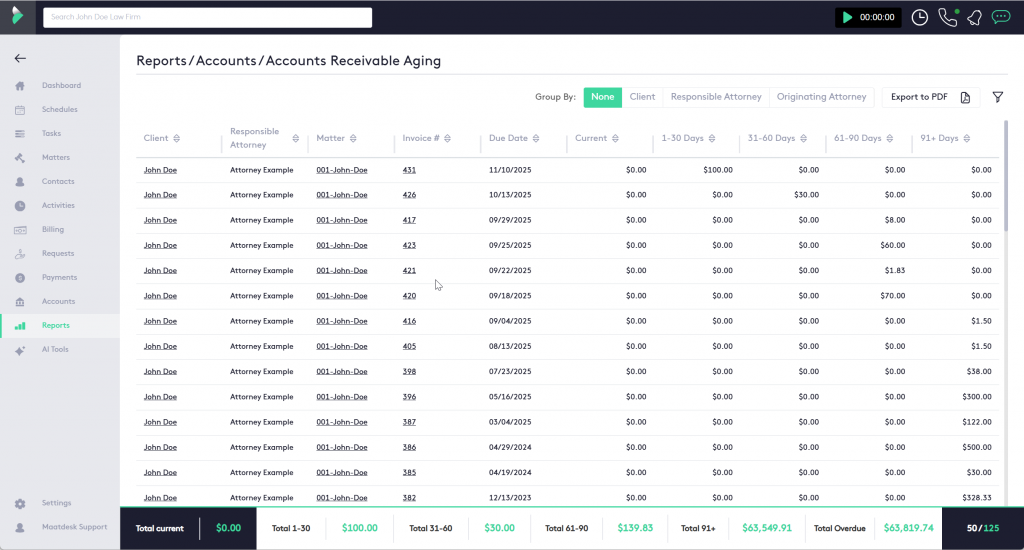
This report shows all outstanding balances grouped into aging categories based on the number of days the invoice is past its due date. It allows the firm to assess the quality of receivables, prioritize collection efforts, and monitor the overall health of the firm’s cash flow. This report is crucial for identifying which clients owe the largest amounts and how long those balances have been outstanding.
Report Window Features
- Export to PDF button: Allows for saving or printing the current view of the report.
- Filter panel: Enables users to narrow the results to display information relevant to their needs, such as filtering by specific attorneys or date ranges.
- Group By options:
- Allows grouping the report by Client, Responsible Attorney, or Originating Attorney, or viewing all entries without grouping.
Table with Accounts Receivable Aging
Shows a detailed list of all unpaid or partially paid client balances, categorized by their aging status. Each row in the report contains:
- Client name
- Responsible Attorney
- Matter name
- Invoice #
- Due Date
- Current (Not yet due or due today)
- 1-30 Days overdue
- 31-60 Days overdue
- 61-90 Days overdue
- 91+ Days overdue (The oldest, riskiest balances)
Client and matter names are typically links that redirect to the respective client and matter dashboards for quick review of their full history.
Summary

The summary section, located at the bottom of the table, provides the overall totals across all displayed items, allowing the firm to see the cumulative outstanding balances:
- Total Current: The total amount of invoices that are not yet past their due date.
- Total 1-30: The total outstanding balance for invoices 1-30 days past due.
- Total 31-60: The total outstanding balance for invoices 31-60 days past due.
- Total 61-90: The total outstanding balance for invoices 61-90 days past due.
- Total 91+: The total outstanding balance for invoices over 90 days past due.
- Total Overdue: The total sum of all balances past their due date (1-30 + 31-60 + 61-90 + 91+).
3. Billing History
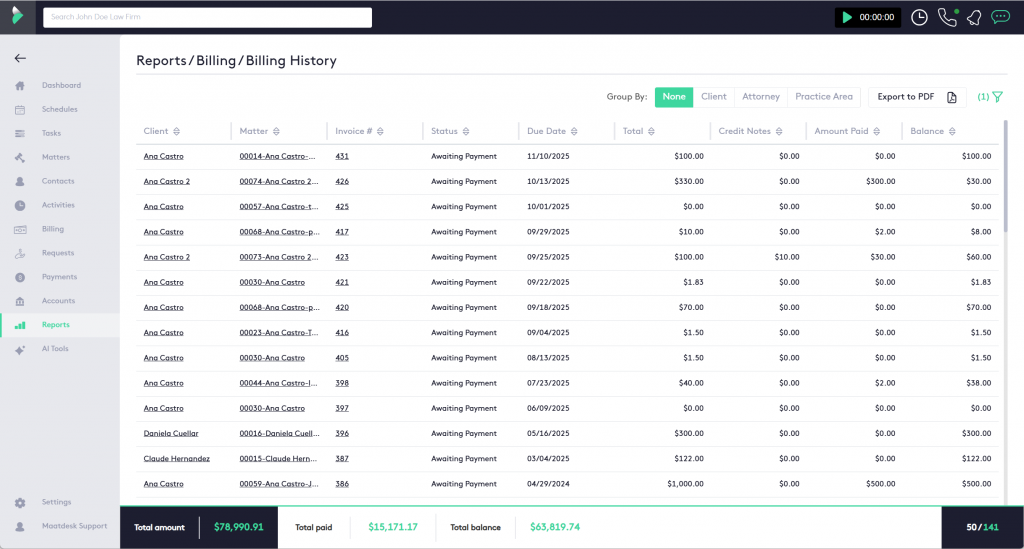
This report provides a comprehensive chronological record of all generated bills within the system. It allows the firm to track the lifecycle of every invoice, from creation through payment and final balance, offering a granular view of billing activity. This report is essential for auditing billing processes, reviewing past payment activity for specific clients, and ensuring the accuracy of outstanding receivables.
Report Window Features
- Export to PDF button: Allows for saving or printing the current view of the report.
- Filter panel: Enables users to narrow the results to display information relevant to their needs, such as filtering by specific attorneys or date ranges.
- Group By options: Allows grouping the report by Client, Attorney, or Practice Area, or viewing all entries without grouping.
Table with Billing History
Shows a detailed list of every bill created, along with its current status and financial details. Each row in the report contains:
- Client
- Matter name
- Invoice #
- Status (e.g., Paid, Due, Pending Payment, Draft, Void)
- Due Date
- Total dues (Original invoice amount)
- Credit Notes (Any applied credits)
- Amount Paid
- Balance (Remaining amount due)
Client and matter names are typically links that redirect to the respective client and matter dashboards for quick review of their full history.
Summary

The summary section, located at the bottom of the table, provides the overall totals across all displayed bills, allowing the firm to see the cumulative financial activity:
- Total Amount: The gross total of all invoices displayed in the report.
- Total Paid: The cumulative total of all payments received for the displayed invoices.
- Total Balance: The total remaining outstanding balance for all displayed invoices.
4. Matter Balances Summary
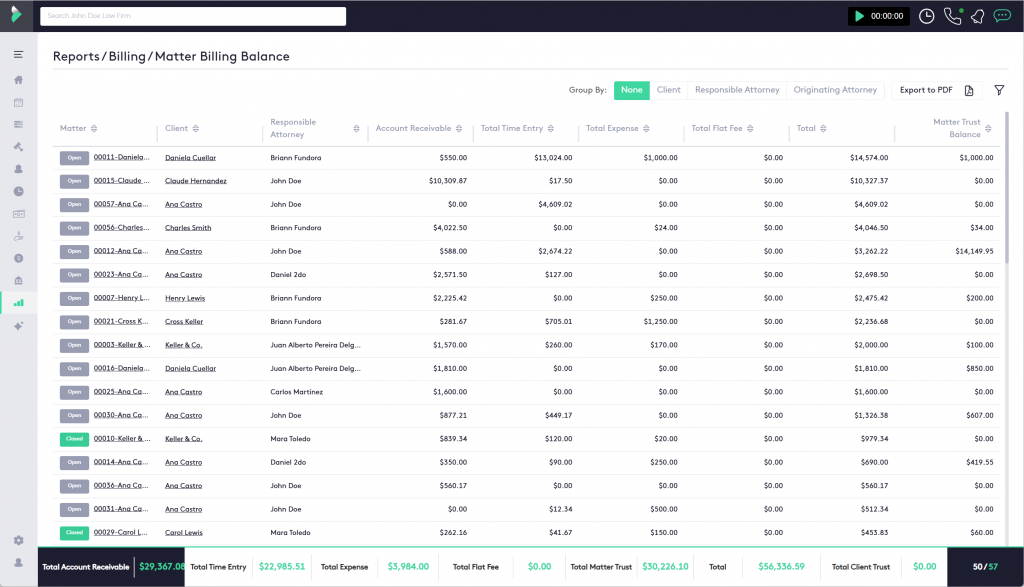
This report provides a comprehensive summary of the financial health of each active matter, detailing all related time entries, expenses, fees, and trust balances. It allows the firm to track profitability, monitor costs, and ensure sufficient client funds are available for billing. This report is essential for routine matter management, financial forecasting, and making informed decisions about resource allocation.
Report Window Features
- Export to PDF button: Allows for saving or printing the current view of the report.
- Filter panel: Enables users to narrow the results to display information relevant to their needs, such as filtering by specific attorneys or date ranges.
- Group By options: Allows grouping the report by Client, Responsible Attorney, or Originating Attorney, or viewing all entries without grouping.
Table with Matter Balances
Shows a detailed financial breakdown for each matter. Each row in the report contains:
- Matter name
- Client name
- Responsible Attorney
- Account Receivable (Total outstanding balance for all unpaid invoices related to the matter)
- Total Time Entry (Total value of unbilled time entries)
- Total Expense (Total value of unbilled expenses)
- Total Fee (Total value of all fees associated with the matter)
- Matter Trust (The current balance of funds held in trust for this specific matter)
- Total (The total amount currently owed to the firm, including A/R, unbilled time, and unbilled expenses)
- Matter Fund Balance (The total of all funds held for this matter, usually referring to the operating retainer balance)
Client and matter names are typically links that redirect to the respective client and matter dashboards for quick review of their full history.
Summary

The summary section, located at the bottom of the table, provides the overall totals across all displayed matters, allowing the firm to see the cumulative financial standing:
- Total Account Receivable: The total outstanding balance across all matters (unpaid invoices).
- Total Time Entry: The total value of all unbilled time entries across all matters.
- Total Expense: The total value of all unbilled expenses across all matters.
- Total Fee: The cumulative total of all fees generated across all matters.
- Total Matter Trust: The cumulative balance of all funds held in trust across all matters.
- Total Client Trust: The overall total balance of all funds held in the main Client Trust account.
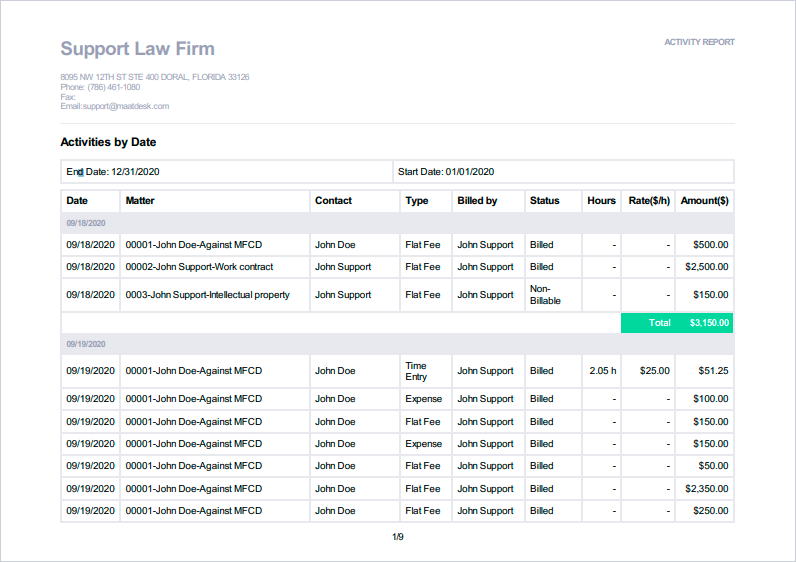
Activities reports
Contains all the reports associated with the activities (time, expense and flat fee entries) in the firm. The analysis possibilities are unlimited and it depends on what the firm needs, through these reports the current financial situation can be analyzed knowing which members generate the most income, in what period of time the funds were affected or which matter needs more funds, to show just a few examples.
The reports available for this category are:
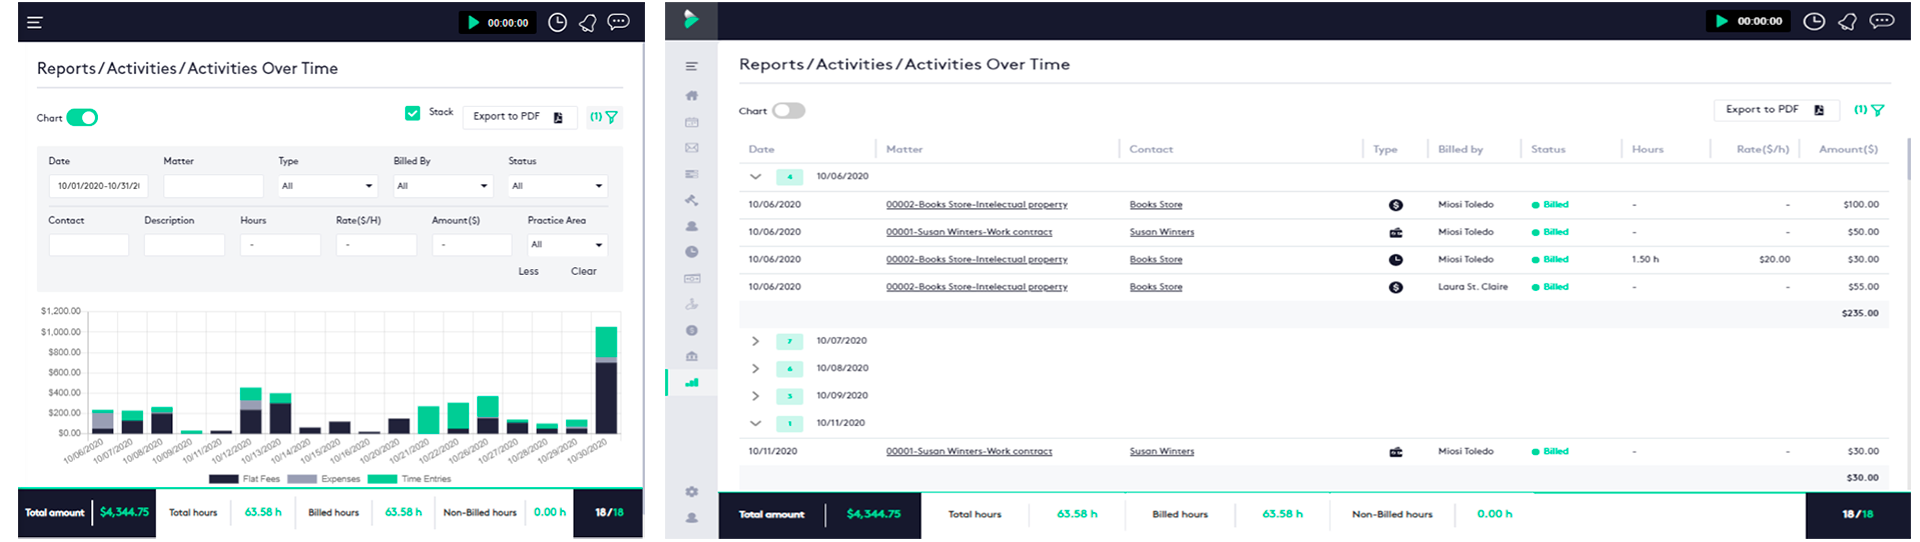
Activities over time
Shows all time, flat fee, and expense entries created over the days. Using this report allows you to track billable targets across the firm and over time without having to spend a lot of time, making the decision-making process less complex by the members of the firm.
This report window will show:
- A Chart option that will display in a bar chart the total amount of each type of activity by date. The Stack option is available for this chart allowing you to see the data points more clearly.
- Export to PDF button.
- Filter panel: Allows to narrow the search to show only the information of interest to the user.
- Table with activities: Shows all the days that at least one type of activity was created. Each day will contain a breakdown of each activity (associated matter, contact, status, type, amount, etc.) and at the end of these, the total amount of all activities for that day.
- Dates are sorted in ascending order.
- Summary: Shows the total amount of all activities, the total hours spent and the amount of that time that has been billed and is still unbilled.
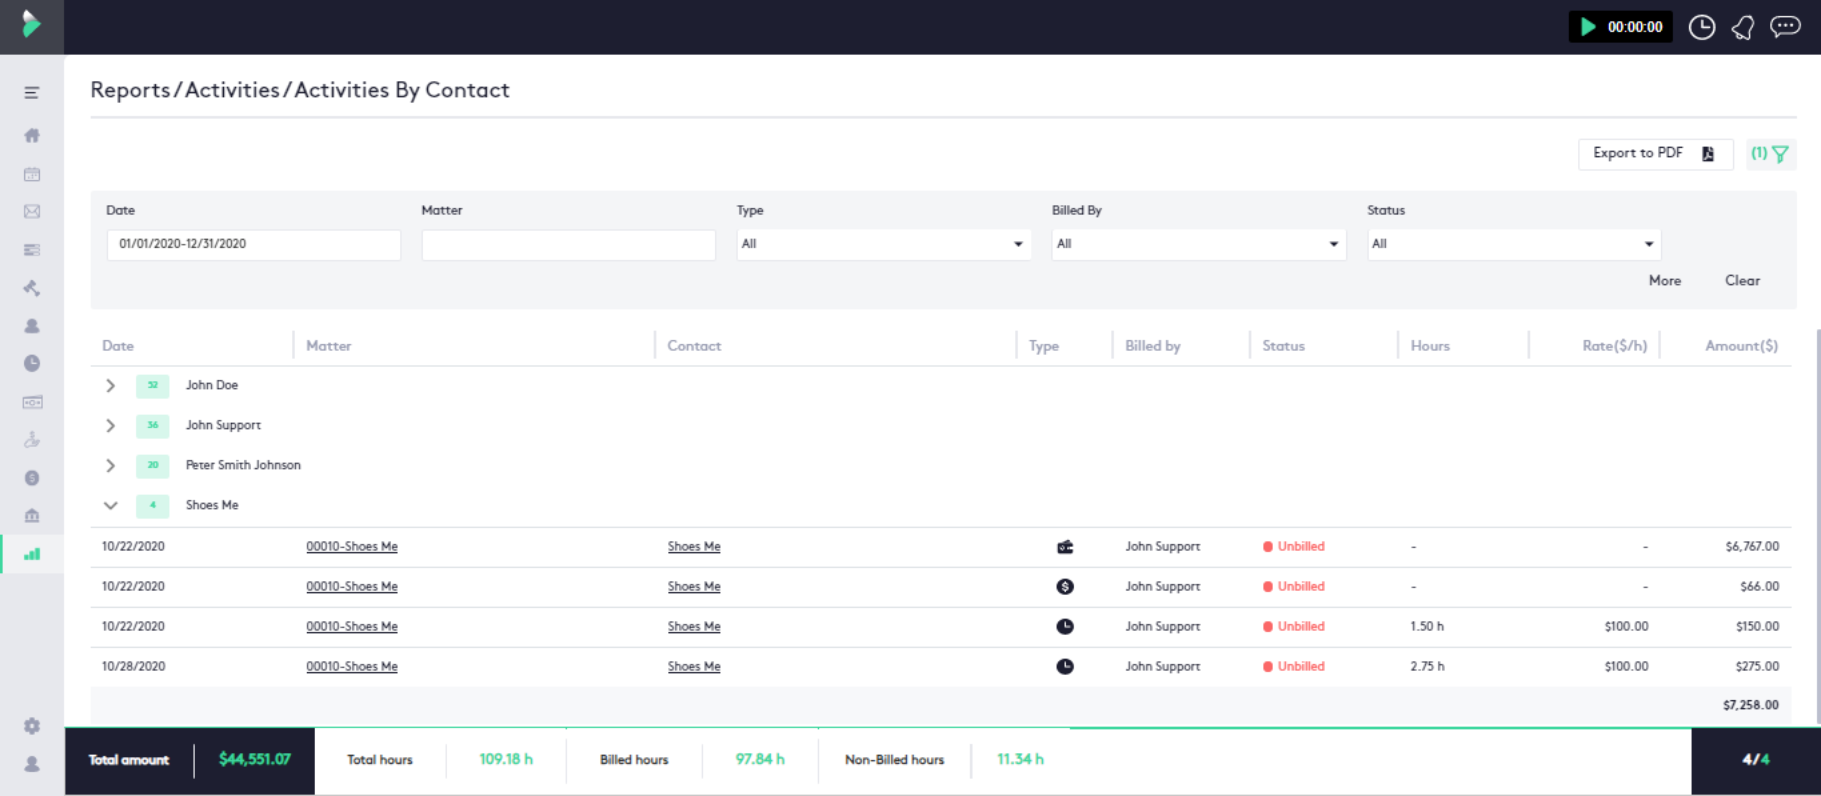
Activities by contact
Shows all time, flat fee and expense entries organized by contacts. Through this report you will be able to analyze how much a client has billed, unbilled or how much has left to pay.
This report window will show:
- Export to PDF button
- Filter panel: Allows to narrow the search to show only the information of interest to the user.
- Table with activities: Shows all contacts for which at least one type of activity was created. Each contact will contain a breakdown of each activity (associated matter, contact, status, type, amount, etc.) and at the end of these, the total amount of all activities for that contact.
- Contacts are sorted in ascending alphabetical order.
- Dates are sorted in ascending order.
- Summary: Shows the total amount of all activities, the total hours spent and the amount of that time that has been billed and is still unbilled.
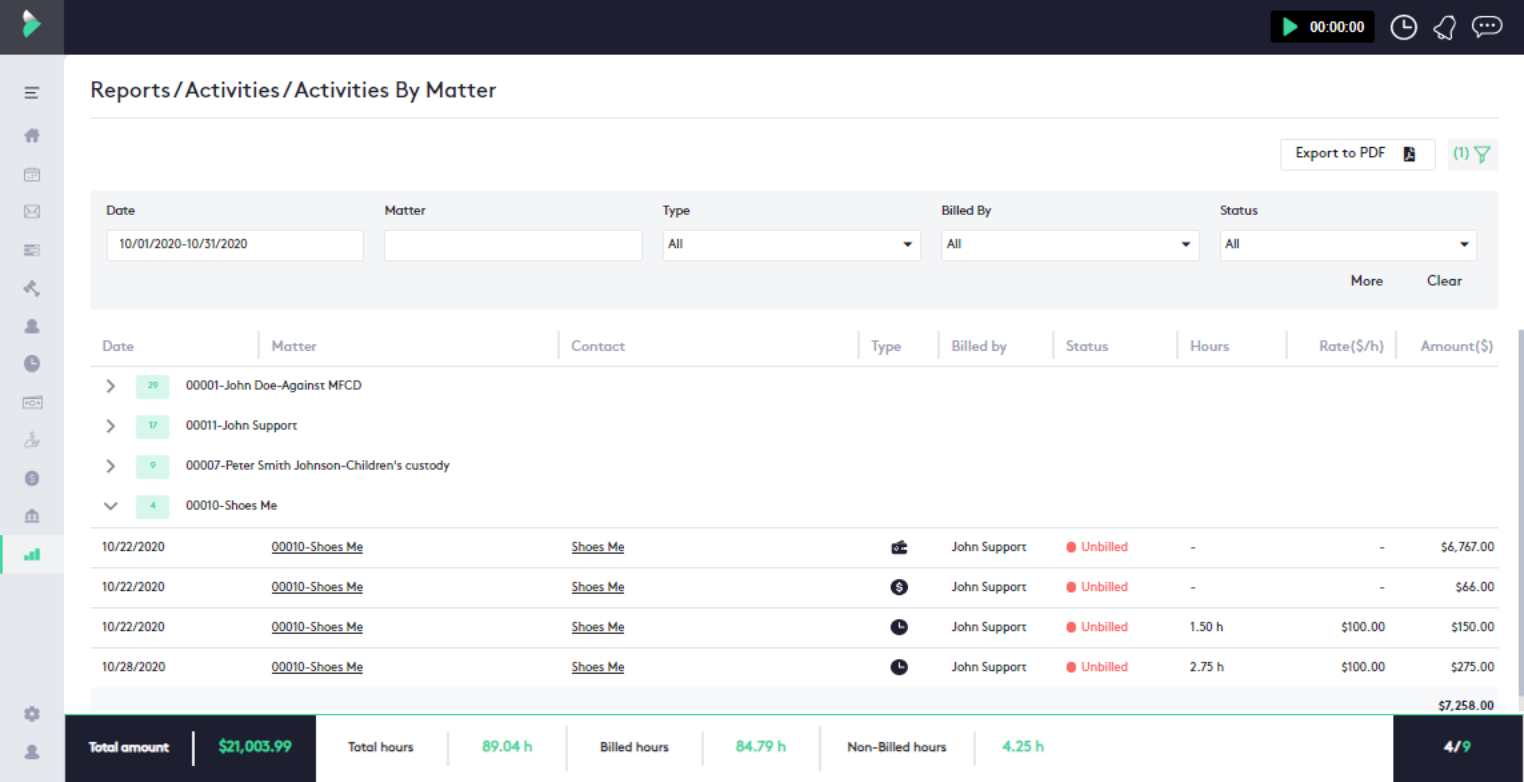
Activities by matter
Displays all time, flat fee and expense entries organized by matter. This report allows to see how much a matter has collected through activities, how much has not yet been collected, or which matter still has unbilled activities.
This report window will show:
- Export to PDF button
- Filter panel: Allows to narrow the search to show only the information of interest to the user.
- Table with activities: Shows all matters for which at least one type of activity was created. Each matter will contain a breakdown of each activity (associated matter, contact, status, type, amount, etc.) and at the end of these, the total amount of all activities for that matter.
- Matters are sorted in descending order by number of activities.
- Dates are sorted in ascending order.
- Summary: Shows the total amount of all activities, the total hours spent and the amount of that time that has been billed and is still unbilled.
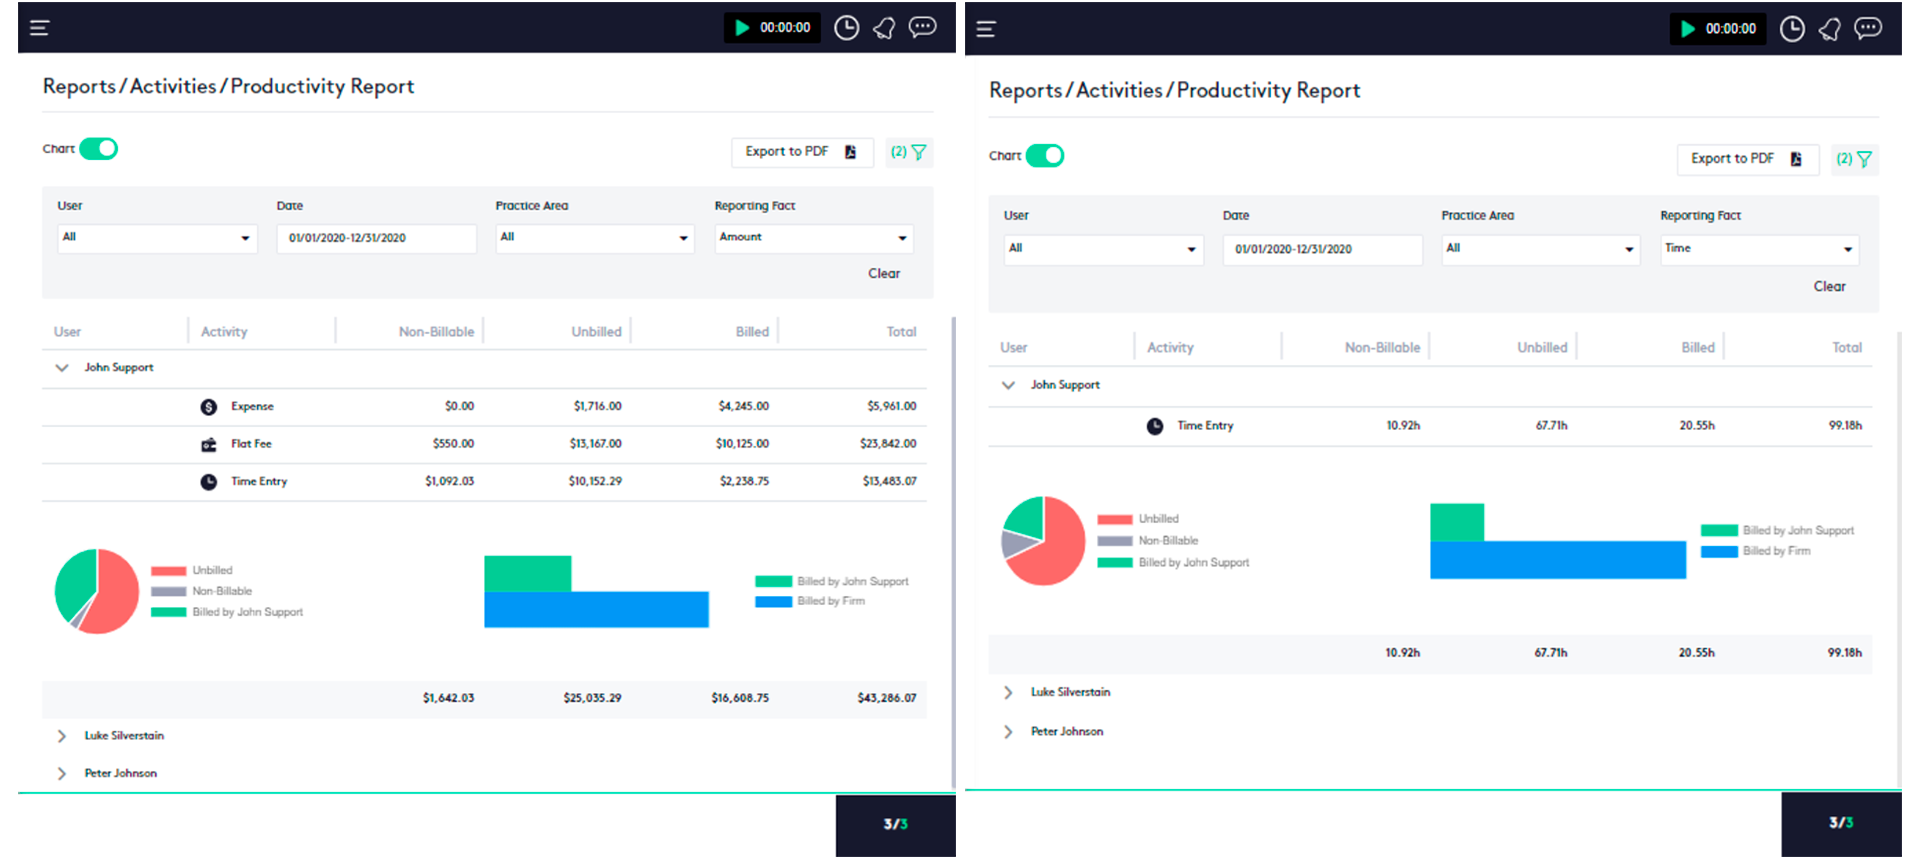
Productivity report
Allows to see how much activity an attorney collected and billed over time for their time and expenses. Using this report, you can analyze the performance and profitability of members of the firm.
This report window will show:
- A Chart option that allows to see the information of each user distributed in two charts at the end of their row, whether the report has been selected by time or by amount:
- Pie chart with the total sum of the activities, distributed by state.
- Bar chart with the sum of the activities billed by the client and the firm.
- Export to PDF button.
- Filter panel: Allows to narrow the search to show only the information of interest to the user. The Reporting Fact option is included as a filter, to select if the report will show information based on time or amount.
- Amount: The report will show the amount related to activities (time, expense and flat fee entries) in each of their statuses.
- Time: The report will only show time entries in each of its statuses expressed in time.
- Table with attorneys: Shows a breakdown by attorney of the activities and each of their statuses. The corresponding charts will be displayed at the end of each user if the Chart option is activated.
Read the following guides or tutorials for more information about activities:
Matters reports
Reports in this category display information about the existing matters in the firm. They are especially useful because they allow you to know the progress of your firm, which member generates more matters and, therefore, a possible increase in profits; or to find out what matters have late payments that affect the funds entry, among many other analysis possibilities.
The reports available for this category are:
Matters over time
Shows all the matters created over the days. By using this report it is possible to see if the firm is being profitable or if in a period of time there is a decrease in the creation of matters, to analyze the causes and act accordingly.
This report window will show:
- A Chart option that allows to see the information about the matters distributed in two charts, selectable by means of a status filter on the right side once the option is activated:
- Over time: Displays matters created over time in a density chart. Using this chart you can see if the firm slows down or productivity decreases if there is a considerable reduction in the creation of matters in a given period of time, or on the contrary if there is an increase.
- By Lawyers: Displays created matters grouped by attorney in a bar chart. With this chart, you can see which member of the firm is the most effective, which are preferred by clients (or the opposite), or which practice area is experiencing the most growth within the firm.
- Export to PDF button.
- Filter panel: Allows to narrow the search to show only the information of interest to the user.
- Table with matters: Shows all the matters that have been created in a table similar to the Matters module window, from which the same actions can be performed on one, depending on the user’s permissions.
- Matters are sorted in ascending order by open date.
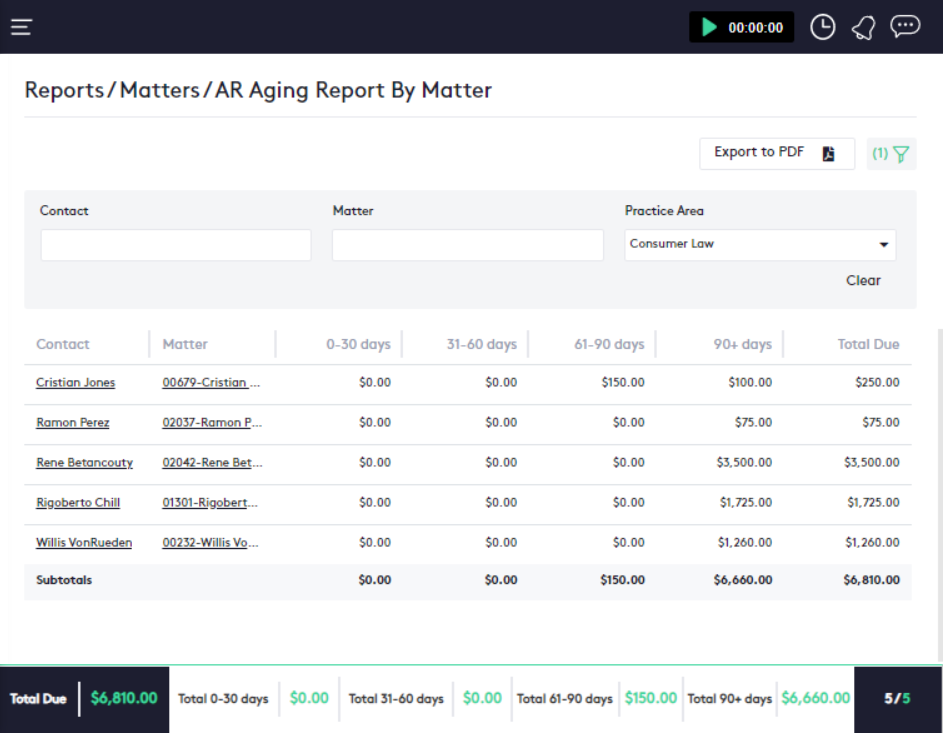
Matters A/R (Accounts Receivable) aging
Shows what receivables need to be dealt with more urgently because they have been overdue longer. This report can act as an indicator to determine the level of risk in obtaining funds within the firm or to determine the financial health of clients. Basically, it allows to break down by users, matters and practice areas all the amounts pending collection due the age of their balances.
This report window will show:
- Export to PDF button.
- Filter panel: Allows to narrow the search to show only the information of interest to the user.
- Table with matters: Shows the contacts and associated matters, and the amount due by aging in 30 days periods.
- The information is sorted by contact in ascending alphabetical order.
- Summary: Shows the total amount due and subtotals by time period.
Read the following guides or tutorials for more information about matters: